🐨 koala · Charts for Jira

Charts for Jira dashboards.
With the exports the others forgot.

Any JQL, project, or saved filter becomes a polished dashboard chart — and every chart exports to XLSX, vector PDF, or PNG. One-off, or on a schedule.

Runs on Atlassian Free for 10 users or fewer No telemetry, ever

See pricing How it works

yourteam.atlassian.net / Engineering dashboard
Koala Chart donut · by status
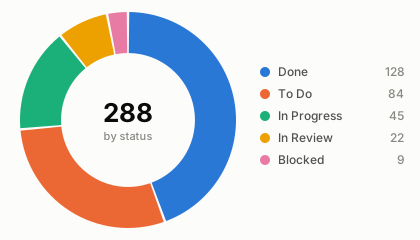
Donut chart of 288 issues by status
Updated just now · Refresh · Schedules XLSX PDF PNG
Koala Chart area · created, 30 days
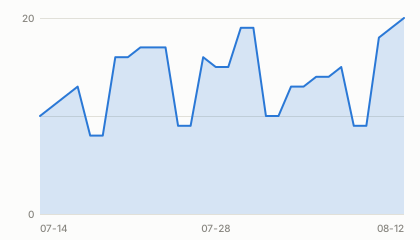
Area chart of issues created over the last 30 days
Updated just now · Refresh · Schedules XLSX PDF PNG
Koala Chart bar · by assignee
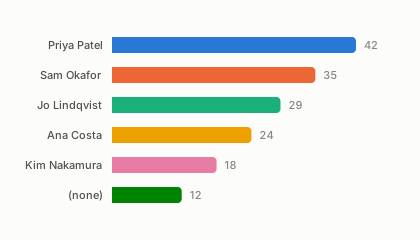
Bar chart of open issues by assignee
Updated 4m ago · Refresh · Schedules XLSX PDF PNG
Koala Chart KPI · unresolved
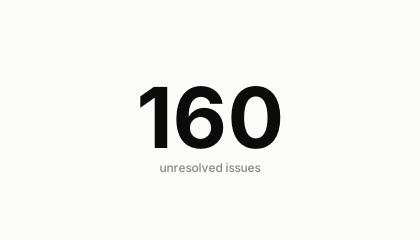
KPI tile showing 160 unresolved issues
Updated just now · Refresh · Schedules XLSX PDF PNG

Not a mockup — every chart above was rendered by Koala’s own chart engine, the same code that draws your dashboard gadgets and your vector PDF exports.

Everything a dashboard chart should do

Six chart types, one two-click setup, and the export story this category has been missing.

📊 Six chart types

Donut, bar, line, area, KPI tile, and table — switch types instantly without refetching. Group by status, assignee, priority, labels, dates, or any field.

📤 Every chart exports

XLSX with the numbers, PDF with the chart as crisp vector art (not a screenshot), and PNG for slides — right from the gadget footer.

⏰ Scheduled exports

Unlimited schedules — daily, weekly, or monthly. Every run is kept for seven days with in-app download, and “Run now” fires any schedule on demand.

⚡ Fast by design

Common charts are answered by Jira’s own search index in under a second, results are cached, and huge filters aggregate in the background with live progress.

🔒 Permission-true

Every viewer sees a chart of the issues their account can see — never yours, never an admin’s. Jira’s permissions apply to every single query.

🚀 Configured in seconds

Pick a project, a saved filter, or paste JQL. One-click starter charts get an empty dashboard to useful in under a minute.

Honest pricing. In writing.

Roughly 40% less per seat than the incumbent charting apps, at every tier — and free where some of them charge a flat fee.

Your Jira sitePer user / month
Up to 10 usersFree
100 users$1.79
250 users$1.09
1,000 users$0.44
5,000 users$0.18
  • The free tier stays free. No silent conversion, ever.
  • Grandfathering: any future price change leaves existing customers on their price for at least 12 months.
  • No telemetry, no tracking, no external calls — your data never leaves Atlassian’s infrastructure.
  • Support answered by the developer, not a queue.

Billed through the Atlassian Marketplace with Atlassian’s standard per-user tiers; prices shown are indicative points on the published curve.

Your data stays inside Atlassian

Koala runs entirely on Atlassian Forge, inside Atlassian’s own infrastructure, and is eligible for the Runs on Atlassian program: it makes no external network calls, so your issue data is never sent to a server operated by Berry.Love or anyone else. It stores only your chart configuration, your schedules, short-lived chart caches, and your scheduled export files (kept seven days). Full detail in the privacy policy.

See how it works →

Marketplace listing coming soon · questions to support@berry.love